The Launch!
Wow, what a launch! Thank you so much Jen, Dani, Steph, and Lisa for all your work setting up this launch! I can’t wait to see what the future events will hold! I was lucky enough to be able to give a lightening talk describing my R journey below - of which I have summarised for those who could not be there! You can also find the slides here.
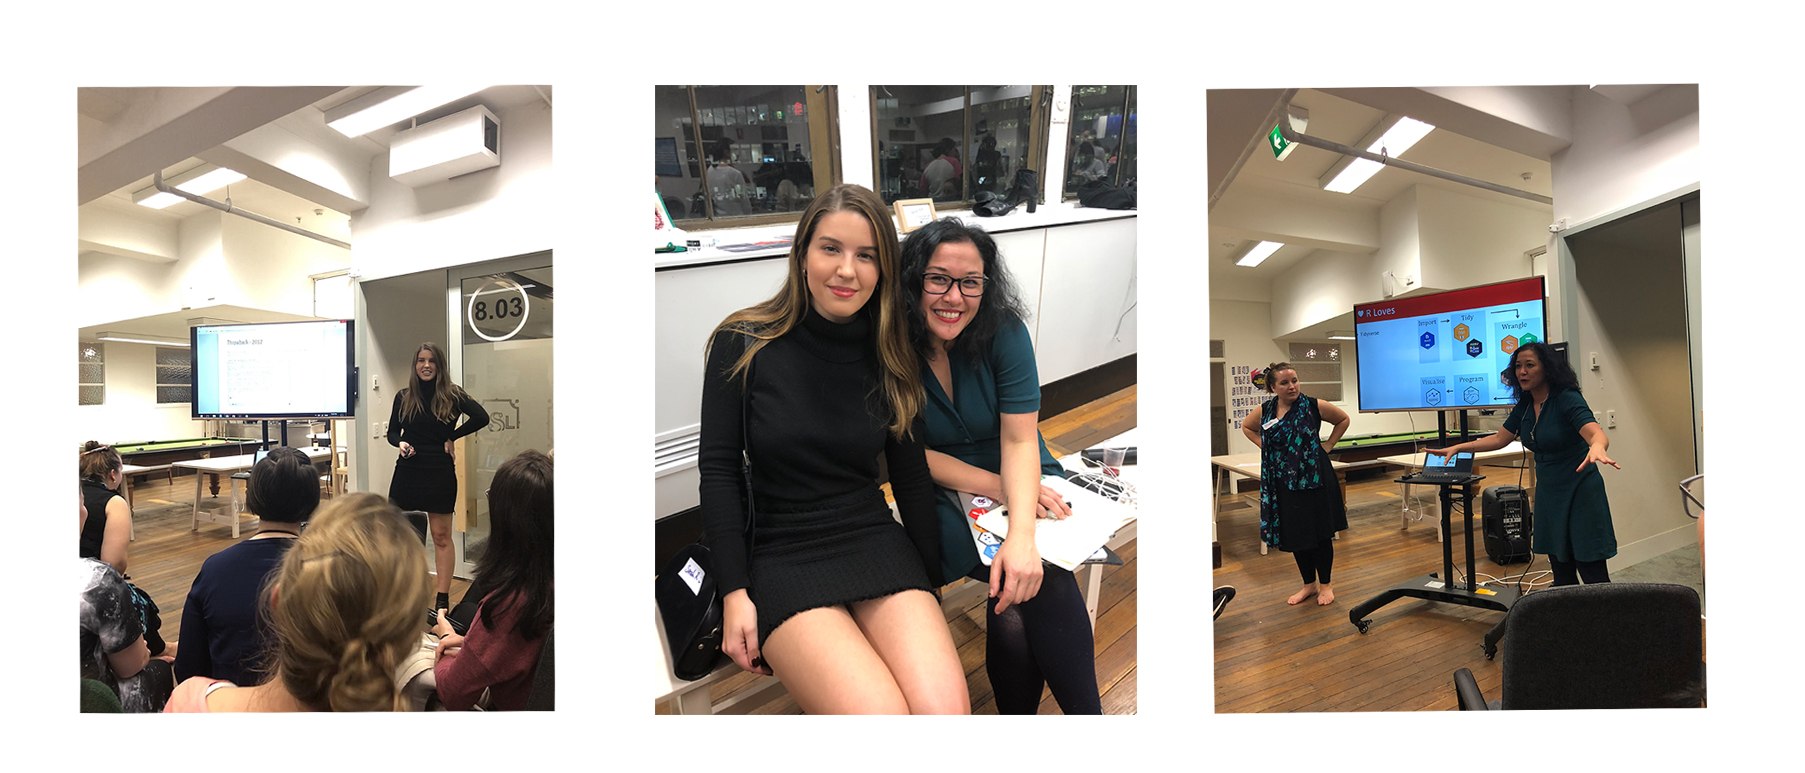
My (long) journey using R - a summary!!
My background is in mathematical statistics, in which I was introduced to R during my BSc degree, and used it from first year all the way through to my honours year. R was introduced to me as a glorified calculator in first year, with it’s main purpose to do basic tests and calclate probabilities! In fact, now that I think about it, I didn’t even read in data into R until my 2nd semester of 2nd year. Crazy!!!
What I was formally taught during my undergraduate degree in R (2012 - 2015)
Statistical modelling techniques
… and through that, baseR (by experience).
Basic report making via Sweave implementation
Essentially - a strong focus on Statistics, and less focus on Data Science! R was a means to the end.
What I was NOT formally taught during my undergraduate degree
tidyverse, eg. ggplot2, dplyr, purrr packages
rmarkdown/ xaringan slides/ blogdown
advanced R topics such as functions, object orientated programming, good programming practice
package development
git/ github/ version control
So why am I telling you all of this?
1) Everyone still has something to learn in R, even if we have been using it for a long time
Especially those of us who learnt R ‘formally’! For example, a lot of us are learning the tidyverse along side you! If you ask us for how to do things, we might give you a long baseR solution…
2) Learning these things takes time and patience, and life does get in the way!
I thought I would spend all my PhD reading textbooks and learning new R techiniques (see below). However research, admin, and teaching can get in the way!
My tips on learning <i class="fab fa-r-project fa-2x faa-pulse animated "></i>
My best improvements in R came from having clear motivations for WHY I was learning new skills
- I learned
ggplot2to make better data vis for presentations/publications/ packages - I learned how to develop packages to complement my research and to also improve workflow
- I learned
Learn from examples! Eg, this presentation was based off Alison Hill’s R Ladies talk about blogdown! Work smart, not hard.
Having a mentor is extremely useful. I found my coding to improve drastically after my honours year as I had great guidance from an expert (my supervisor).